
There are a growing number of websites that offer to rate specific analyst's and blogger's stock picks. One such site is tipranks.com. A detailed description of their service is available on their website. So, I did what any self-respecting financial writer would do – I looked up my performance on TipRanks.com
I have the unique situation of writing for Seeking Alpha from Feb 2010 to Feb 2012 using my given name. Due to compliance issues, during the later days of being a RIA from Sept 2012 to March 2014, I wrote using the pen name Jon Parepoynt. Therefore, I looked up both authors.
The various options for searching performance on TipRanks.com are “stock ratings automatically closed at “1 qtr., 1-yr., or 2-yr.” Comparisons are available using “S&P 500, Sector, or None” .
When selecting “2-yr timeframe” and “None”, George Fisher generated a 16.3% average return per recommendation with a 31 out of 44-success ratio, or 70%. However, when compared to the S&P 500, the results plummeted to -4.1% average return above the S&P and a 20 out of 44-success ratio or 45%.
When selecting “2-yr timeframe” and “None”, Jon Parepoynt generated a 12.2% average return per recommendation with a 40 out of 48-success ratio, or 83%. However, when compared to the S&P 500, the results plummeted to -2.3% average return above the S&P and a 28 out of 48-success ratio or 58%.
I reviewed my own rating and found it obviously quite disappointing. As author George Fisher, I was rated #2019 and as author Jon Parepoynt I was rated #2469 out of 3233 bloggers tracked compared to the S&P. Man-o-man, I would never take my own advice.
TipRanks.com website has been discussed on the contributor forums of Seeking Alpha. One contributor contacted TipRanks.com to clarify their measuring methodology and below is the reply, as posted on the forum:
I understand there is a thread on SeekingAlpha regarding TipRanks and I would like to explain a bit how experts performance are measured. I would appreciate it if you could publish this on the thread so all the dear contributors will get answers to their questions.
Before I dive deep into the calculations, I would like to point out that TipRanks is here to let laymen investors know who they can trust there are 3100 sell side analysts 3200 bloggers (out of which 800 are from SA) and it is amazing to see that average bloggers performs so much better than an average sell side from Goldman Sachs. And our users love the fact that they can easily find rock stars from blogs and see what they have to say as experts.
Our measurement system was developed by a leading professor of Finance from Cornell University called Roni Michaeli who is an industry leader in performance research and published hundreds of academic articles in the field of analyst performance.
When our machine detects a recommendation to Buy a stock, we "virtually" buy it, but we also buy relevant benchmarks, the SPY and an ETF of the sector of the stock recommended….When a blogger recommends a stock we will close his position either after the time defined or if he writes another article about the stock (if it is a buy and then a buy we will close first position and open a new one, and the performance of both "buy" calls will be added to his portfolio).
We also measure success rate which is the number of stocks who had positive return in case of no benchmark or outperformed the benchmark if a benchmark is chosen.
We then run a Z test on the success rate meaning that the more the data is significant the more weight the expert is getting (e.g. if someone has 10 out of 10, he is not as good as someone who has 75 out of a 100 even though the first one has 100% success rate and the second has only 75%)
These 2 factors are combined into a single ranking which is displayed by the amount of stars. Our platform was awarded twice as the best of show on Finovate for its power and innovation and there are many thousands of happy users using it on a daily basis. It is a powerful tool to research stock and filter out underperforming analysts when using analyst consensuses, which institutional investors use as a benchmark. bWe were also offered many times to close the platform for individuals and provide it only to professional money managers and refused to do so, arguing that our vision is to empower the main street.
I would be happy if you could publish this on the thread to clarify the questions some contributors might have. Sincerely, Uri.
So, I dug a little deeper and decided to upload my own portfolio based on the specific advice as offered by tipsrating.com. The site does allow for review of each data point they analyze with the date and share price. I use the premium service at Morningstar.com to track my personal portfolio and to evaluate portfolio construction.
I uploaded into the M* portfolio tracker the same buys as listed on TipRanks.com, using a cumulative $2,000 per recommendation. If there were three recommendations offered, the portfolio would be credited with three $2,000 purchases on the day each recommendation was made. The difference between TipRanks and M* was most interesting. Needless to say, there is some stark and distinctive variances.
Using the M* portfolio analysis tools, each position as described by TipRanks was added. There were two companies that were bought out: Thomas and Betts was bought by ABB for a substantial gain of 200% and CHG was purchased by Fortis at a 30% profit. Both of these were stock mergers and the site had difficulty correctly accounting for the shares. Three positions were closed. There were some discrepancies in prices quoted in the linked article and on the site, such as DMLP was quoted as $15.16 when the actual market price for the day was $20.50.
First off, according to M*, the performance of the 44 Jon Parepoynt selections were “1-yr” 16.6% total returns, and a “Since Purchased Annualized” total return of 17.1%. M* also offers a “Personal Total Return” calculation that incorporates the timing within the month of deposits/buys into the portfolio, and is a bit higher at 18.4% and 21.6% respectively. According to M*and using the M* US Market Index as a benchmark, the index returned 16.2% and 18.9% respectively. Below is their return performance graph.
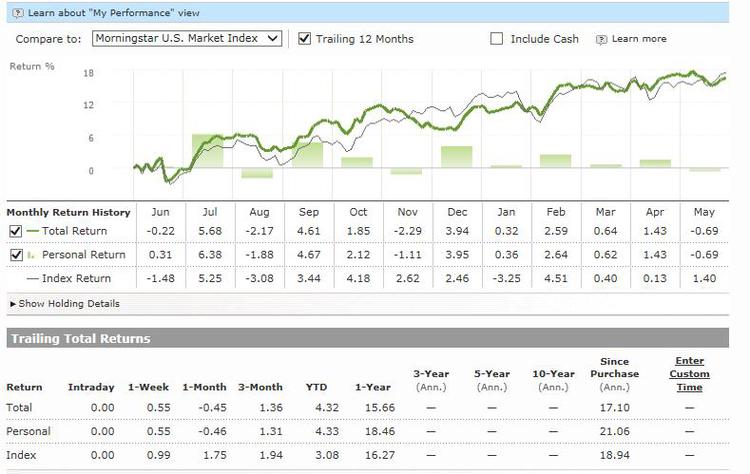
Jon Parepoynt Performance Sept 2012 to May 2014
Combining the 44 recommendations of Jon Parepoynt and the 48 recommendations of George Fisher brought the number to 92 specific recommendations in 59 different companies. Adding these specific recommendations together would produce the following M* performance chart:
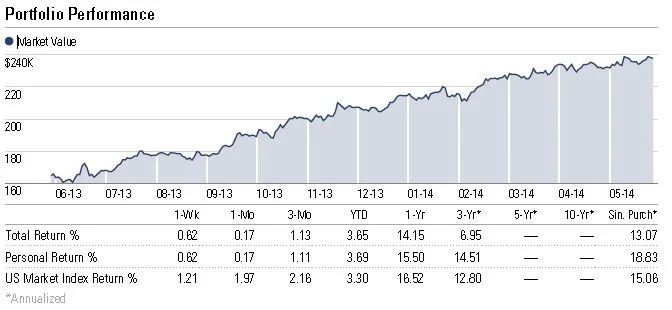
Combined George Fisher and Jon Parepoynt Performance Feb 2010 to May 2014
There are two very important differences with these comparisons. The first is the concept of price-returns as offered by TipRanks.com and the total returns offered by M*. The second is the asset allocation. M* offers their calculation combining both capital gains and income while tipranks.com offers price-based capital gains only. The portfolio income is $6,600 annually, for a current yield 2.8%.
The second major difference is asset allocation. The 59 companies with 92 transactions nowhere near duplicated the sector represented in the index. Below is a sector breakdown of the final portfolio as offered by M*.
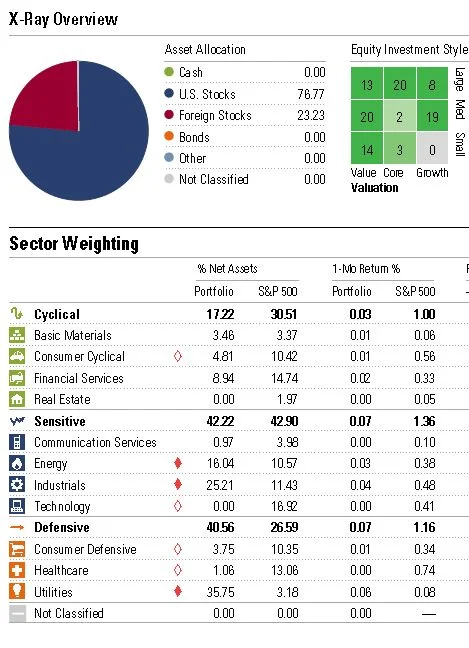
Sector allocation of the 56 companies in the combined portfolio
As shown, there are large gaps of underweighted sectors and substantial overweighting of others. Specific stock recommendations are not necessarily made to conform to asset allocation parameters and focusing on certain sectors, such as utilities, will skew both investor expectations and performance.
Probably the most interesting aspect with tracking of my recommendations is the omission of about 2/3 of the articles published on Seeking Alpha. I have a combined total of almost 300 articles published since 2010 and TipRanks.com offers a link to 92 articles While not all 300 are specific stock recommendations, there are more offerings than listed on TipRanks.com
On second thought, I guess I would take my own advice – and do. However, I will not publish a continuum of all 300+ articles, as these 92 should suffice.
Below are the positions in the combined portfolio, from M*:
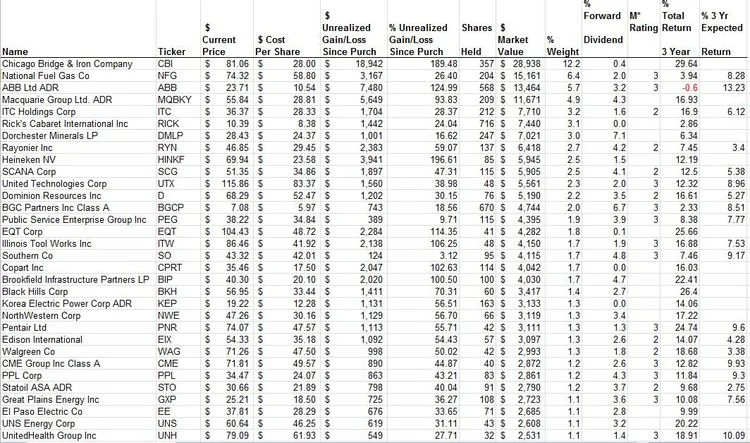
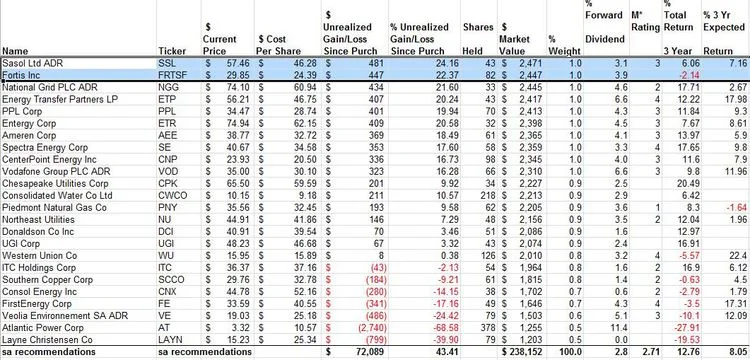
Performance by position and purchase date for Combined portfolio
Disclosure: I am long CBI, NFG, ITC, RICK, DMLP, RYN, UTX, BGCP, SO, ETP, SE. All long positions are followed by MyInvestmentNavigator.com monthly newsletter.
Update June 1: I received the following email from TipRanks:
"Hi George,
My name is Gilad Gat and I’m the CTO of TipRanks. I read with great interest your article on MyInvestmentNavigor.com. I wanted to make a few clarifications as to our performance measurements.
My goal is to clarify and to get your perspective so we can fine-tune and perfect our methodology.
· To measure stock ratings we use the EOD price on the day of the recommendation. We have started an internal committee on this and are considering using the opening price of the day following the recommendation. Would be interested to get your thoughts on this.
· For S&P-500 we use SPDR S&P 500 (ticker SPY) which also incorporates the dividends of the S&P-500 companies.
· Stock prices used by our engine are taken from Xignite, a leading financial provider recommended by Nasdaq.
· For sector benchmarking we use the sectors from Yahoo! Finance, we will likely switch to sectors definitions by Xignite during the month of June.
· Performance is measured on a per-rating basis, not as a portfolio (i.e., no rebalancing and re-investment of dividends).
· My team will evaluate the two companies that have been bought-out to verify we deal with such cases correctly.
Please feel free to contact me directly with any question, comment or concern."
I appreciate your time and interest in Guiding Mast Investments, George Fisher,